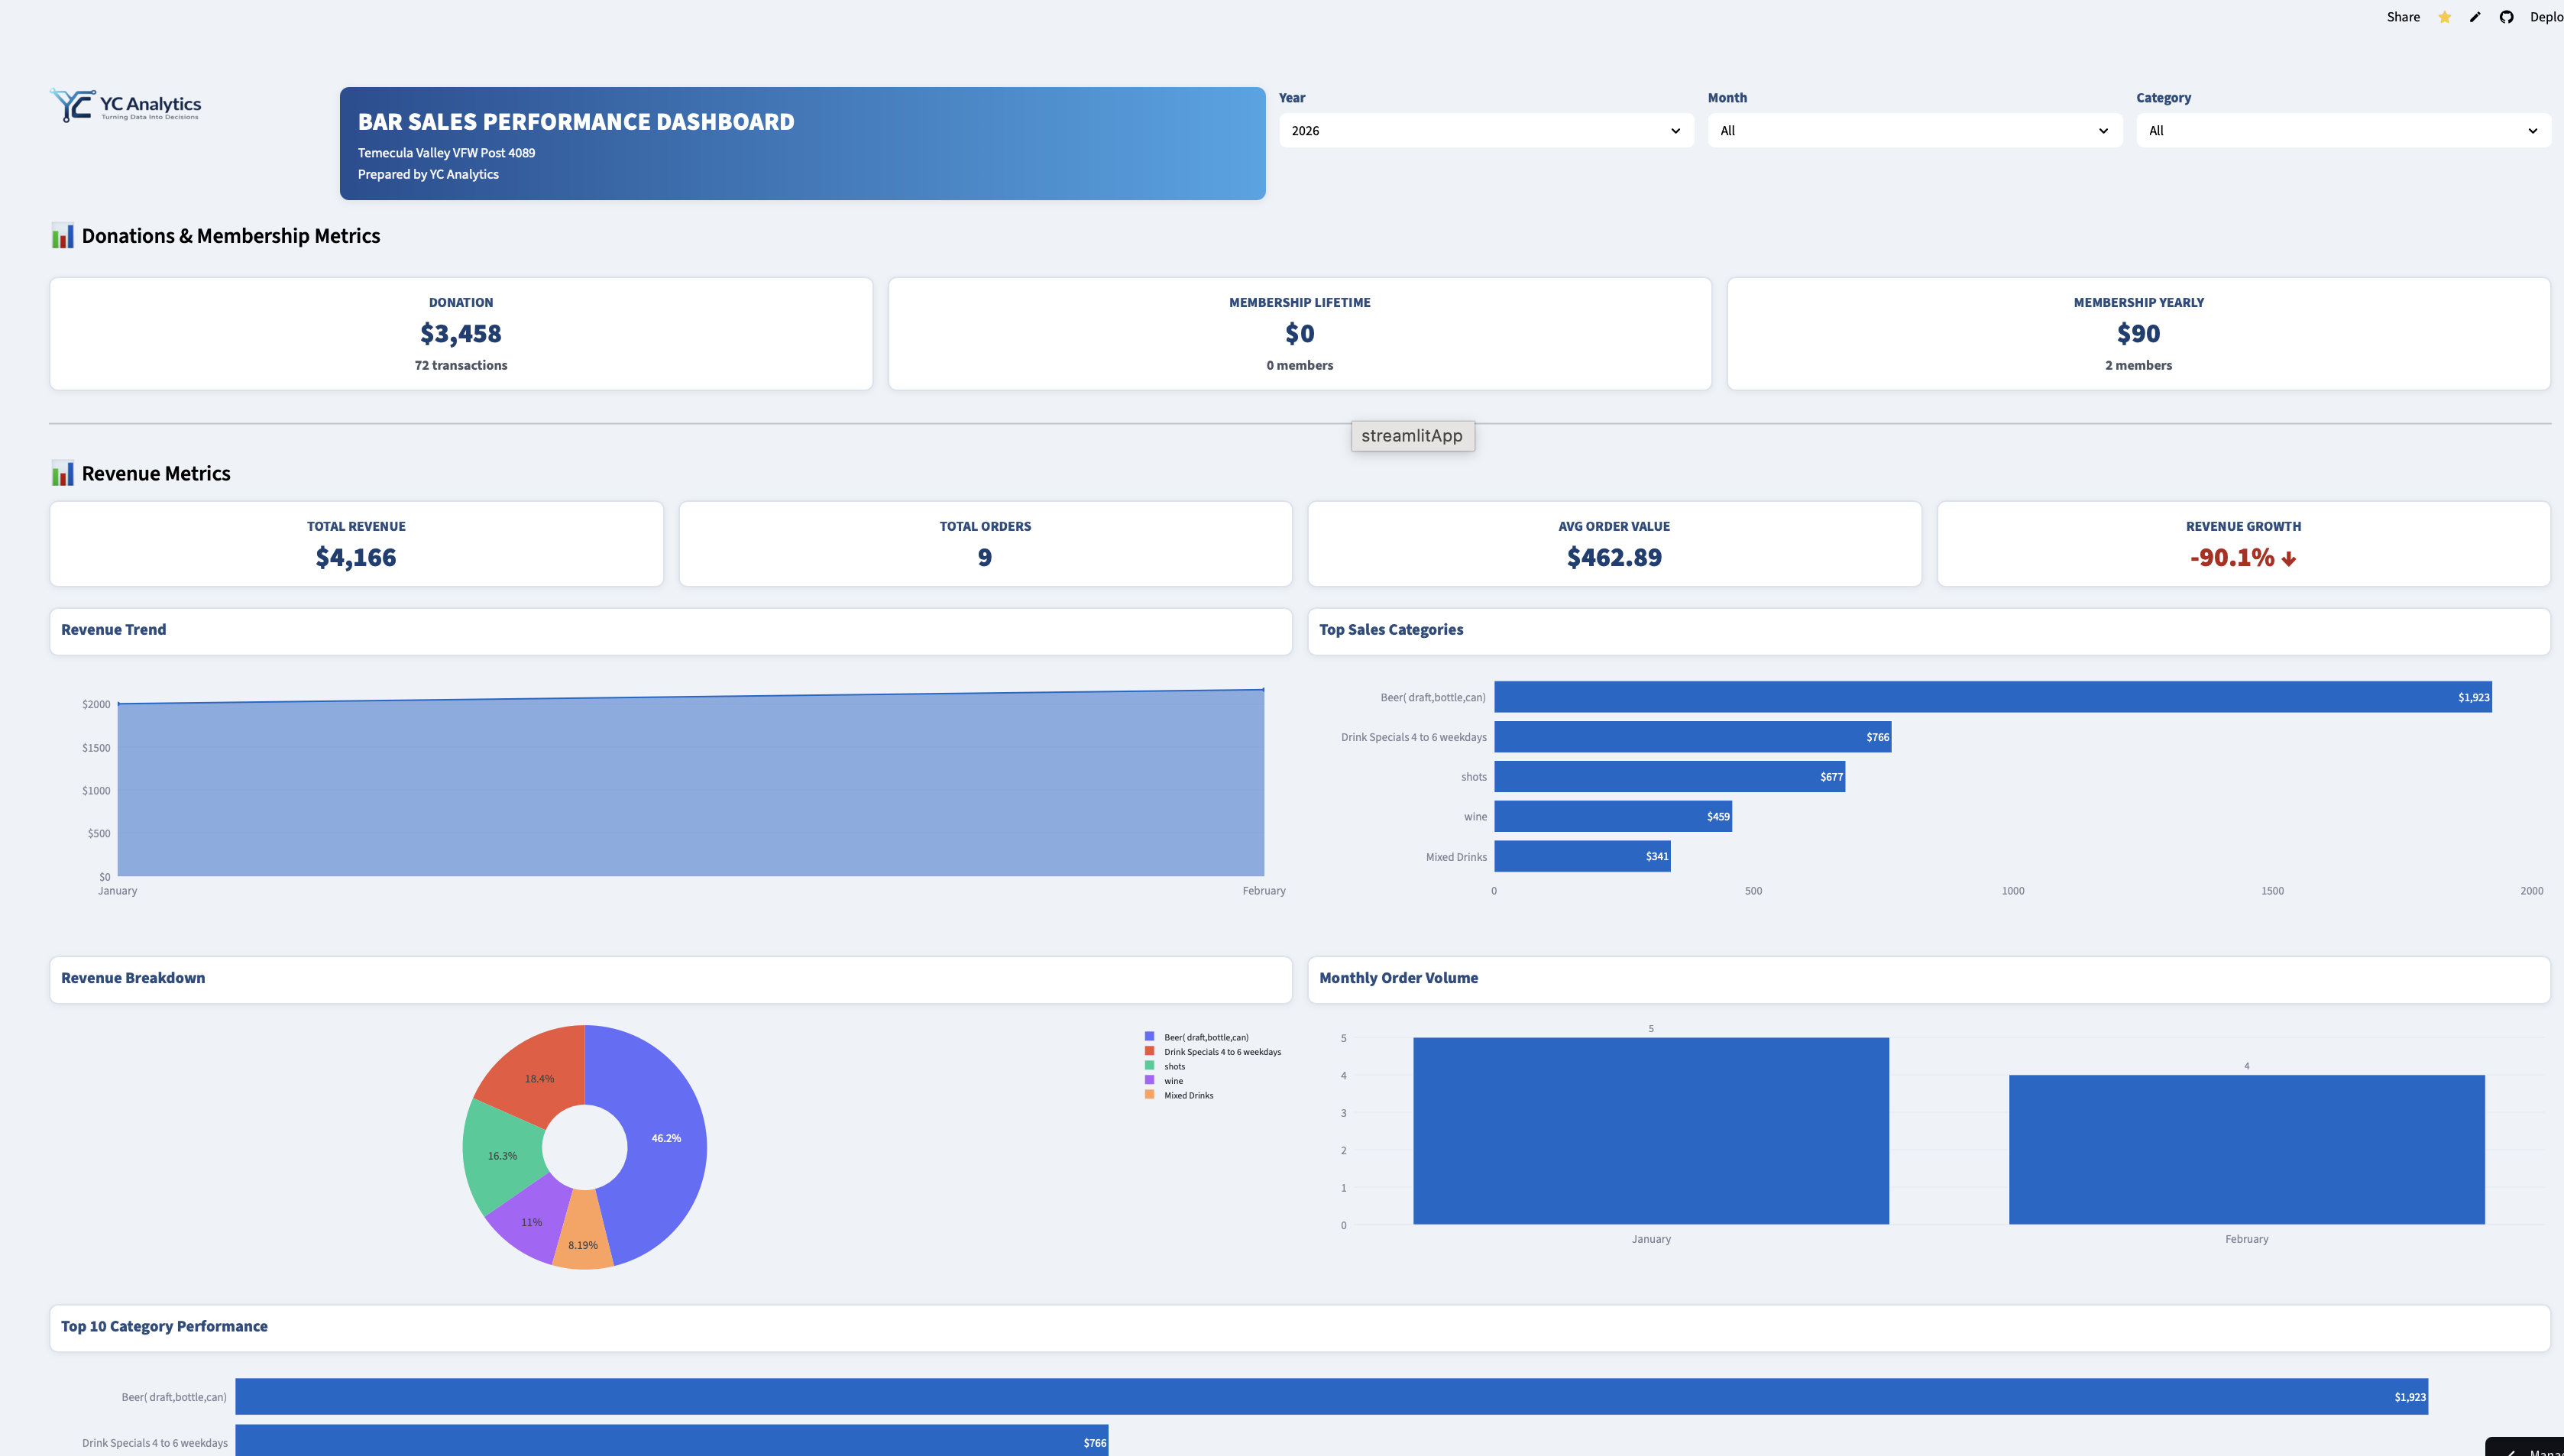
Real projects, real results dashboards, data visualizations, and presentations built to turn complex data into clear decisions.
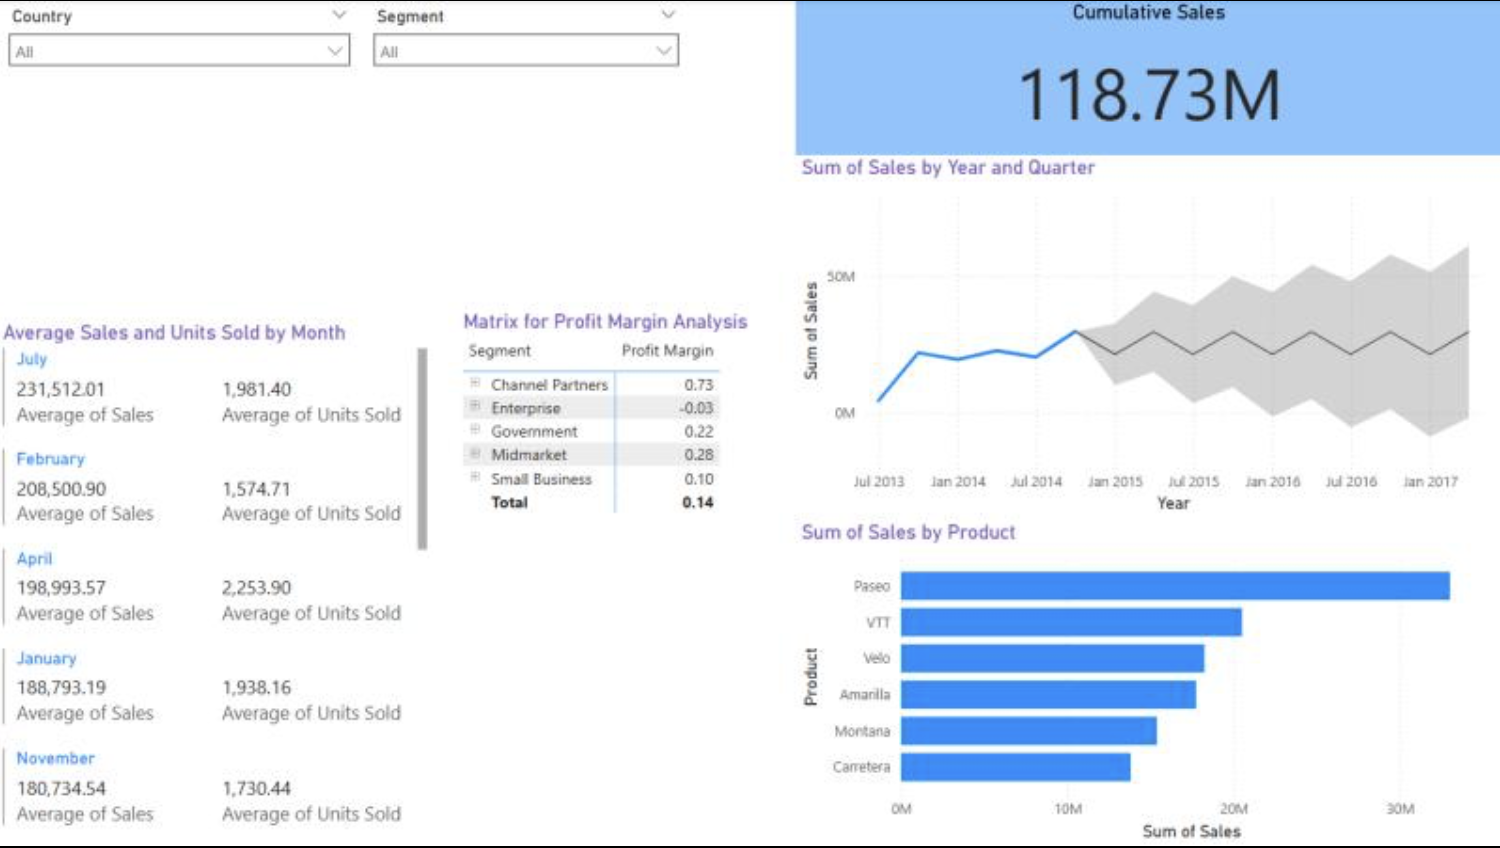
Interactive client-ready dashboard analyzing retail beverage sales performance. Features KPI tracking (Revenue, Orders, Avg Order Value, Growth), monthly trend analysis, top category insights, revenue breakdown, and automated executive summary with PDF export. Built with Python, Pandas, Plotly, and Streamlit. Enabling faster, data-driven decisions and seasonal trend analysis for inventory planning.
YC Analytics transformed monthly sales records into a client-ready dashboard that helps management track revenue performance, compare categories, identify seasonality, and export executive-ready PDF summaries.
Sales data existed across monthly category records, making it hard to answer practical questions about revenue drivers, seasonality, and year-over-year performance.
Built a Streamlit dashboard with KPI cards, trend views, category rankings, revenue mix visuals, executive recommendations, and PDF export for stakeholder reporting.
Reduced manual reporting effort and gave stakeholders a reusable analytics tool for monthly review, planning, and communication.
Streamlit, Plotly, Python, executive reporting design, and PDF export workflow.
Excel dashboard tracking aviation maintenance training across 21 qualification tracks for 7 technicians. Consolidates weekly signoff data showing completion trends, technician performance, and progress vs. targets. Tracks 5,323+ signoffs, enabling leadership to monitor workforce readiness and identify where support is needed in real time.
YC Analytics upgraded an existing Excel workbook into a clearer, more decision-ready dashboard that helps leadership monitor qualification progress, track weekly performance, and identify where intervention is needed.
The original workbook contained useful data, but leadership had to spend too much time manually reviewing it to understand progress at a glance.
Reorganized the dashboard for readability, improved progress visualizations, and structured the workbook for clearer trend review and future benchmark tracking.
Created faster visibility into completion progress, easier identification of lagging areas, and stronger support for weekly and monthly performance reviews.
Microsoft Excel, dashboard design, KPI visualization, and trend-focused reporting structure.
Demographic dashboard analyzing Puerto Rican population distribution across the United States using U.S. Census data. Features geospatial choropleth visualization, ranked Top 10 states bar chart with logarithmic scale for interpretability. Built with Python, Pandas, and Plotly. Transforming raw census data into clear, interactive geographic insights for market research.
YC Analytics transformed raw demographic data into a clear geographic dashboard that supports strategic planning, market targeting, and resource allocation across U.S. states.
Raw Census-style data needed cleaning, normalization, and stronger visual design before it could support real business or planning decisions.
Built a choropleth map, ranked comparison chart, and KPI annotations to make concentration patterns and market opportunities easier to interpret.
Created a scalable analytics asset that helps stakeholders prioritize high-density states while recognizing growth opportunities in secondary markets.
Python, Pandas, data cleaning, geospatial mapping, logarithmic scaling, and visualization design.
This project focused on combining Excel and Tableau to create a dashboard that analyzes MLB team salaries. It contains player salary data for each year from 2012 to 2018, including each player's name, team, position, and salary for that season. It also includes a team graph listing each team, along with the division, league, city, state/province, and country.
To support executive decision-making, I developed an interactive Power BI dashboard that transformed static financial reports into dynamic, user-driven insights. The project highlights cumulative sales, average sales, and units sold using DAX measures for time-based aggregation, while slicers for Country and Segment give users deeper context across business units and regions. I also added a sales forecasting line chart with configurable confidence intervals and designed a matrix visualization to display profit margins by country and segment, revealing operational efficiency across the organization.
"Yasim has consistently demonstrated reliability and speed in delivering high-quality work. His ability to listen to clients' needs sets him apart. He fully understands project requirements and aligns his work accordingly. Yasim is always punctual, meeting deadlines without compromising quality."
Let's turn your data into decisions. Reach out to discuss your analytics, dashboard, or design needs.